
CAEL Speaking Topics to Practice your Visual Literacy
CAEL Speaking task 3 asks you to talk about information that is presented in a visual form. For many test-takers, this is a very difficult task. These CAEL Speaking topics will help you develop your visual literacy so that you can interpret the information quickly. Once you’ve worked through these question, take a look at the IELTS Academic writing task 1 questions in a google image search and keep practicing.
As always, I’m happy to score your response for free. Just send a recording of your response to angela@ottawa-english.com. If you want more detailed feedback on your response please use my paid writing or speaking correction service.
Bar Charts
Percentage of the population aged 65 and over
The chart below gives information about the UK’s ageing population in 1985 and makes predictions for 2035.
Prepare a two-minute presentation that summarizes the information, report the main features, and makes any comparisons.
Hint: As you prepare your response to this prompt, think about the largest and smallest gaps for each country.
Airport Visitors 1995-2000
The chart below shows the number of travellers using three major airports in New York City between 1995 and 2000.
Summarize the information by selecting and reporting the main features, and make comparisons where relevant.
Hint: Keep in mind that you’re looking for trends. In other words, think about the most consistent and the most fluctuating number of visitors.
Factors Affecting Work Performance
The bar chart below shows the results of a survey at a major company. The survey looked at two groups of workers. The first group was 18-30, and the second group was 45-60. Furthermore, the chart shows the factors that affect their work performance.
Prepare a report that summarizes the information, compares any important data, and identifies the main features.
Hint: When you think about this question, consider the things that have the greatest influence, those that have very little influence, and those that have the same level of influence in both groups.
Graphs
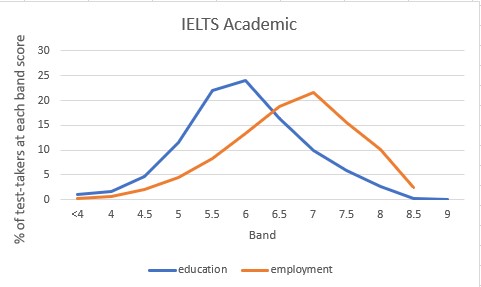
IELTS Academic 2019
The graph shows the band scores achieved by IELTS test-takers in 2019.
Summarize the information by selecting and reporting the main features and making comparisons where relevant.
Hint: For the first trend, you could talk about the higher requirements for employment. For the second trend, you could talk about the lower requirements for education.
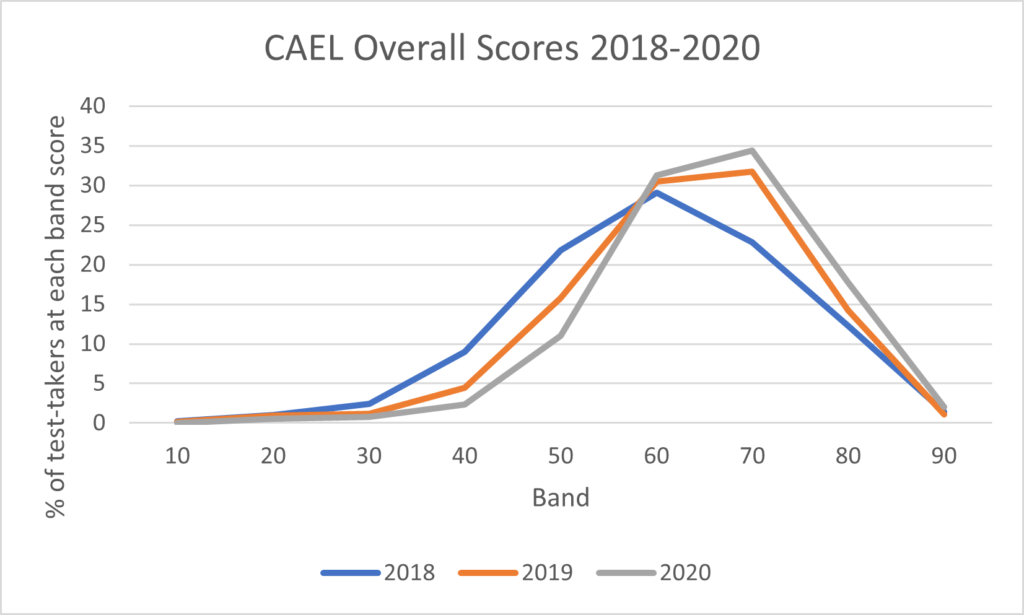
CAEL Overall Scores 2018 – 2020
The graph shows the overall scores achieved by CAEL test-takers in the years between 2018 and 2020.
Summarize the information by selecting and reporting the main features and making comparisons where relevant.
Hint: With this prompt, I’d be inclined to talk about the area that spans band 60 and 70. In other words, for the first trend, I’d talk about the greatest downward trend in 2018. For the second trend, I’d focus on the greatest rise during the years that followed. Because these lines follow a very similar pattern, you don’t need a lot of detail before 60 and after 70. However, it is important to mention the similarity.
Burnaby Public Library
The graph shows the number of books read by men and women at Burnaby Public Library from 2011 to 2014.
Summarize the information by selecting and reporting the main features and making comparisons where relevant
Hint: With this prompt, my first trend would be the changing positions of men and women during the four-year period. Once I had done that, I would talk about the change in direction. That would be my second trend.
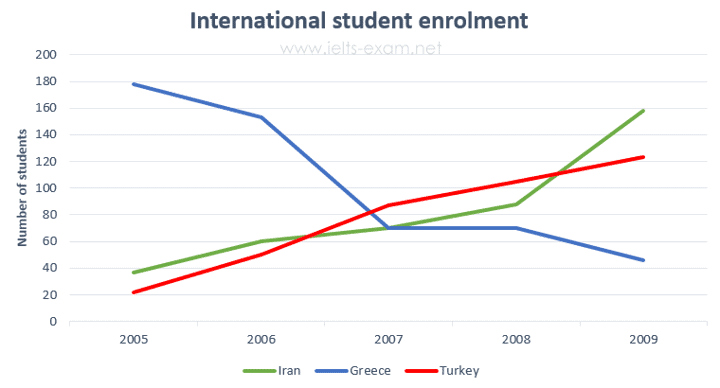
International Student Enrolment
The line graph gives information about the number of Iranian, Greek and Turkish students who enrolled at Sheffield University between 2005 and 2009.
Summarize the information by selecting and reporting the main features and making comparisons where relevant.
Hint: As your visual literacy improves, it becomes easier to see the basic trends like the ones in this graph. For this question, firstly, I’d talk about the concurrent rise of enrolments in Turkey and Iran. Secondly, I’d talk about Greece’s plunge.
To sum up, with all of these questions, it’s important to say what the trend is and then use the details in the graph to support your statement. Above all, keep in mind that you should never talk about things that you can’t see in the picture.
Tables
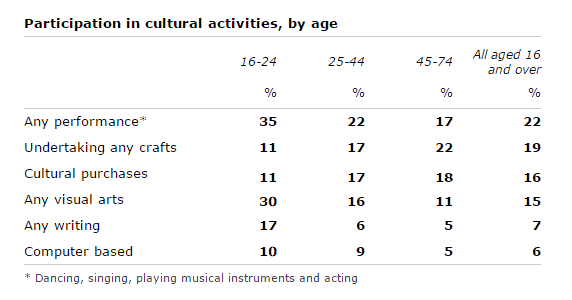
Cultural Activities
The Table below shows the results of a survey that asked 6800 Scottish adults (aged 16 years and over) whether they had taken part in different cultural activities in the past 12 months.
Summarize the information by selecting and reporting the main features and making comparisons where relevant.
Hint: The trends in this table would be firstly, the 2 most popular for all groups, and secondly, the 2 least popular for all groups. In addition, I would develop each trend by talking about the group’s constituents.
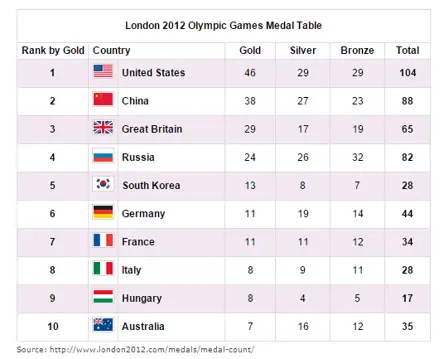
Olympic Medals
The table below shows the number of medals won by the top ten countries in the London 2012 Olympic Games.
Summarize the information by selecting and reporting the main features and making comparisons where relevant.
Hint: For these trends, firstly, talk about the top 4 totals for the first trend. Secondly, talk about the bottom four for the second trend. Finally, in order to develop these ideas, talk about the things that make up those totals.
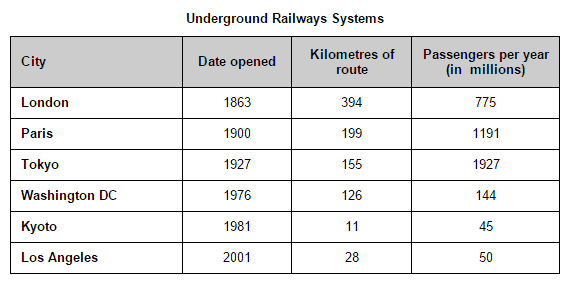
Underground Railways
The take below gives information about the underground railway systems in six cities.
Summarize the information by selecting and reporting the main features and making comparisons where relevant.
Hint: For this one, my first trend would be about the two most popular for passengers, and my second trend would be about the two least popular.
Pie Charts
Someland Expenditures
The pie charts below show the changes in annual spending by local authorities in Someland in 1980, 1990 and 2000.
Summarize the information by selecting and reporting the main features and making comparisons where relevant.
Hint: For these trends, Firstly, I would focus on the biggest and smallest changes at the beginning and end of the twenty year period. Secondly, I would complete my response by saying whether they went up or down in 1990.
Retail Sector Sales
The two pie charts below show the online shopping sales for retail sectors in Canada in 2005 and 2010.
Summarize the information by selecting and reporting the main features and making comparisons where relevant.
Hint: Here, focus on the biggest and smallest changes as your two trends.
Canadian Graduates
The graphs below show the post-school qualifications held by Canadians in the age groups 25 to 35 and 45 to 55.
Summarize the information by selecting and reporting the main features and making comparisons where relevant.
Hint: For these trends, firstly, I would focus on what was most interesting to the two age groups. Secondly I would talk about what was least interesting.
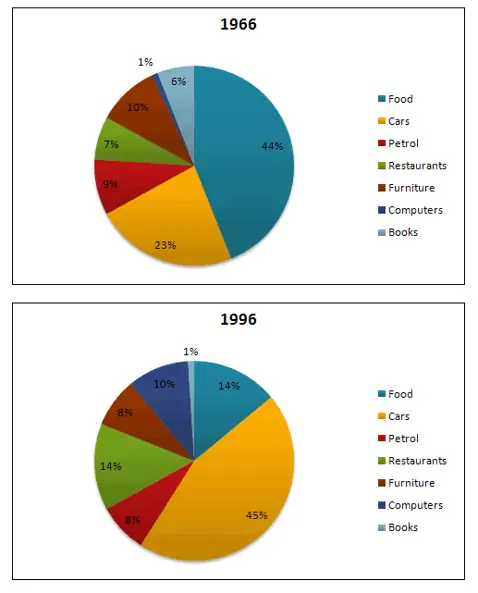
US Expenses
The charts below show US spending patterns between 1966 and 1996.
Summarize the information by selecting and reporting the main features and making comparisons where relevant.
Hint: For these trends, firstly I would focus on the biggest change. Secondly, I would talk about the smallest change.
Processes
Work Experience Requirements
The flowchart shows the process involved in completing the work experience requirement for university students.
Summarize the information by selecting and reporting the main features and making comparisons where relevant.
Hint: With the process question, you don’t need to worry about trends. that is to say, with this type of question, what’s important is that you follow the arrows.
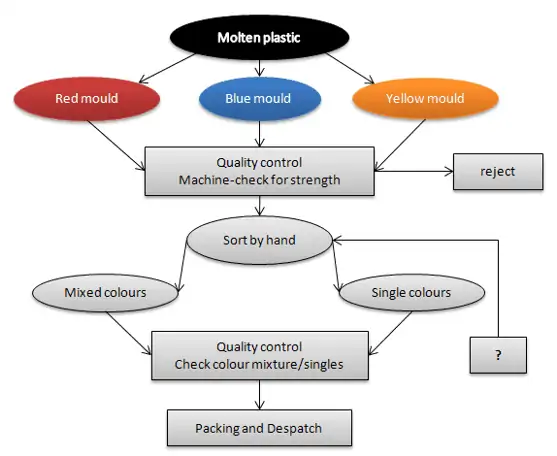
Plastic Production
The flowchart illustrates the production of coloured plastic paper clips in a small factory.
Summarize the information by selecting and reporting the main features and making comparisons where relevant.
Hint: With the process question, you don’t need to worry about trends. That is to say, with this type of question, it’s all about being able to follow the arrows and describe the process very clearly.
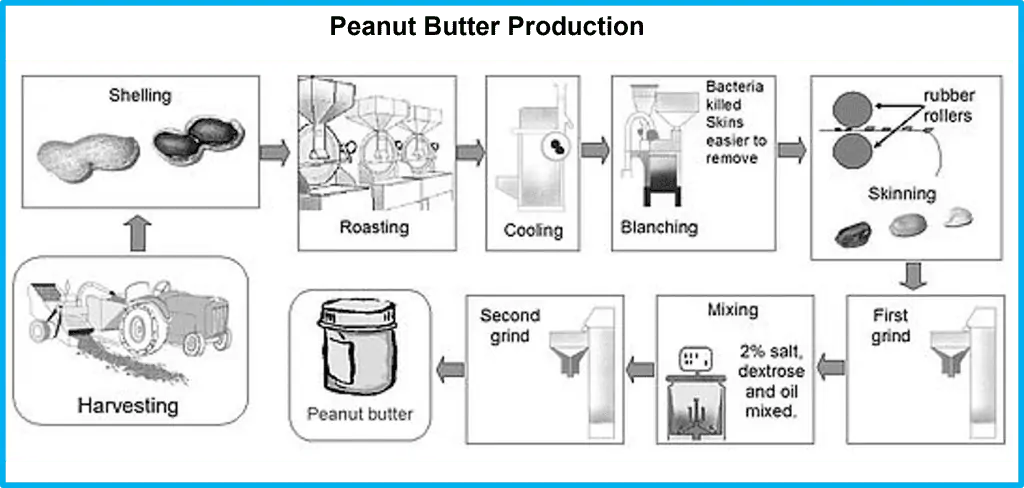
Peanut Butter Production
The diagram shows the process that a peanut goes through to become peanut butter.
Summarize the information by selecting and reporting the main features.
Hint: Focus on the arrows if you get this types of question. In other words, you don’t need to worry about trends here; however, you do need describe every part of the process clearly.
Maps
Canterbury
The map below is of the town of Canterbury. A new school (S) is planned for the area. The map shows two possible sites for the school.
Summarize the information by selecting and reporting the main features and making comparisons where relevant.
Hint: If you get a map question, you don’t need to talk about trends. That is to say, with this type of question, you need to describe the advantages and disadvantages of both locations. In addition to that, you must mention each component in the map. In other words, you should mention the two populations and the main roads. Importantly, you should mention the countryside housing and the town centre, and don’t forget the direction and the university, because they are important too.
Felixstone Developments
The map shows the development of Felixstone between 1967 and 2001.
Summarize the information by selecting and reporting the main features and making comparisons where relevant.
Hint: In a map question like this, you need to describe the biggest changes that took place during the period between 1967 and 2001. Once you’ve done that, you should describe the things that didn’t change.
More Visual Literacy Practice
For more visual literacy practice in preparation for CAEL speaking task 3, try the IELTS Academic Writing task 1 questions on these websites. At this point, your goal is to develop your visual literacy, so it doesn’t matter whether you’re preparing for CAEL or IELTS.
IELTS test online Has lots of practice questions
English exam – Offers a variety a practice questions.
IELTS Buddy – has a nice selection too